What’s new in our Optical Modeling and Design Software?
Talbot Effect in X-Ray Imaging
X-ray imaging has seen many applications in e.g. the areas of medical imaging and industrial inspection. A common design of X-ray imaging devices is based on the Talbot effect – a diffractive effect, where a periodic structure, like a grating, will produce the exact image of the structure at a certain distance behind it.
Being a software platform based on fast physical optics, VirtualLab Fusion offers suitable solvers to propagate light through such devices, including all diffractive effects. For a short demonstration of VirtualLab Fusion’s capabilities in this area, check out the examples below:
Fourier Transform Spectroscopy
Fourier Transform spectroscopy – an optical metrology method that can be used to measure the optical spectrum of a source with a Michelson interferometer – is a
well-known technique commonly used in a wide range of applications that can go from investigating air or water quality to pharmaceutical analysis.
To help the optical designer understand all the effects that can play a role in such devices, the fast physical optics software VirtualLab Fusion provides all the necessary tools to perform a full propagation through these systems. This naturally includes all coherence and interference effects that are happening at the detector plane. Furthermore, through our new Detector Add-Ons, the user has access to all physical quantities that are of interest, such as irradiance or radiant flux.
Please take a look at the links below to find an example where the temporal coherence length of a polychromatic source is investigated through a Michelson interferometer, as well as some thorough documentation of our Detector Add-Ons.
Ince-Gaussian Beams for Optical Tweezer
Optical tweezers, scientific instruments that utilize highly focused beams to manipulate objects on a sub-microscopic level, can be used to hold individual cells or molecules and have therefore been used for many applications in biology, medicine and nano-chemistry.
To ensure proper functionality of these setups, the beam employed needs to have a stable structure throughout the focusing process. While multiple different fundamental Gaussian, Hermite- or Laguerre-Gaussian modes are good candidates for the task, a setup first proposed by Chu et al. [Opt. Express 16, 19934-19949 (2008)] uses Ince-Gaussian beams, as they are able to create stable 2D-light patterns of increasing complexity.
In the fast physical optics modeling and design software VirtualLab Fusion, the Ince-Gaussian source allows the user to easily configure a custom Ince-Gaussian Mode and use it as a source for their system. Combining this source with a non-sequential modeling approach we demonstrate a full simulation of the system proposed by Chu et al. Please also find below a detailed document describing the functionality and usage of the Ince-Gaussian beam source.
In-Depth Analysis of Polarizer Gratings with Sub-Wavelength Structures
Ultra-sparse nanowire grids – grating structures consisting of periodic dielectric wires with a cross section much smaller than the used wavelength – exhibit strong polarization dependencies over a wide range of wavelengths. These characteristics make them a viable choice as nanostructured polarizers for optical systems, where compact integrability and thermal stability are critical, and this approach has distinct advantages over its conventionally used counterparts based on birefringent crystals or multilayer systems.
In this week’s newsletter we perform a detailed analysis of such a structure in the fast physical optics modeling and design software VirtualLab Fusion, using the work of [J. W. Yoon et al., Opt. Express 23, 28849-28856 (2015)] as a reference. In this example, we not only calculate the polarization-dependent efficiencies of the light reflected and transmitted by the periodic structure, but also visualize how the field propagates inside, clearly illustrating the polarizing behavior of the nanowire arrangement: The TM-polarized part travels through practically unaffected, while the TE-polarized component is almost completely reflected.
This analysis is enabled by VirtualLab Fusion’s Field Inside Component Analyzer: FMM. You can also find a detailed guide to this at the links below.
Cross-Platform Simulations with Python
The fast physical optics software VirtualLab Fusion prides itself on its “connecting field solvers” approach, which brings together different specialized electromagnetic field solvers applied on different components in a seamless, non-sequential way, to enable the physical optics simulation of the whole system. The logical extension of this approach is to not only connect solutions inside the software, but to also allow cross-platform simulations to reap the benefits from other programs or programming languages in combination with the physical-optics know-how that characterizes VirtualLab Fusion, thus extending the options for simulation, optimization, design and post-processing.
Hence, in this week’s newsletter we are doing a deep dive in how to use the programming language Python to call and control simulations in VirtualLab Fusion. Please take a look at the documents linked below to find a detailed guide on how to set up and work with the interface between Python and VirtualLab Fusion, accompanied by an application example in which we perform a parameter sweep on a grating in 1D and 2D.
Real Beam Splitter for Interferometer Applications
Interferometry is a keystone technology for many applications in the area of optical metrology. It is widely used for the measurements of e.g. surface profiles, defects and mechanical or thermal distortion with high precision. Most interferometry systems rely strongly on beam splitters that divide the incoming beam. A detailed investigation of all the different physical effects these components may have on the light requires a modeling approach that can simulate real optical beam splitter components.
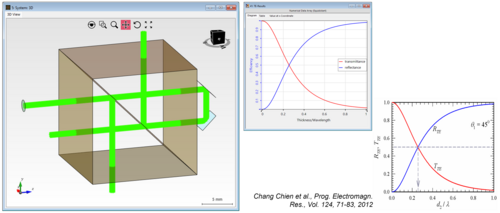
With this in mind, we share two use cases in this week’s newsletter that incorporate the most common designs for such kind of beam splitters. In the first one we have a look at a cube beam splitter based on Frustrated Total Internal Reflection (FTIR) and demonstrate how the gap influences the transmission and reflection efficiencies. In the second use case we investigate the phase shift created by a real beam splitter in comparison to an idealized, functional one.
New Features for Lightguide Modeling
With the release of version 2023.1 a whole pack of new and interesting features have been added to the fast physical optics modeling and design software VirtualLab Fusion. Fitting to one of the themes of the release – the “Detector Revolution” – we presented new tools to extract information about your optical system by means of the new Universal Detector and various helpful Add-ons.
In this week’s newsletter we want to highlight especially the new additions that have been made to the Lightguide Toolbox – our go-to tool for anyone interested in applications in the field of augmented and mixed reality (AR & MR), like the design and analysis of Near-Eye Displays. With the new release users have access to an overhauled Uniformity Detector that now includes graphical representations of the pupils that are used to calculate the uniformity, for a more convenient use. Furthermore, we also added a brand-new detector add-on designed to share information from the lightguide with the detector. With its help, users can now detect the field inside a lightguide and see the grating regions superimposed on the result. For more information, please take a look at the documents below.
Read moreOptical Thin-Film Measurements by Ellipsometry
Ellipsometry is an optical measuring method that utilizes the polarization changes that happen whenever light is reflected by (or transmitted through) a surface, e.g. of a bulk material or thin-film. Over time it has gained popularity in semiconductor and optical coating applications due to its higher sensitivity in comparison to traditional reflection measurements. Therefore, ellipsometry is now used to accurately characterize composition, roughness, thickness, crystalline properties, electrical conductivity, and other material properties of diverse samples.
In the latest release of the fast physical optics software VirtualLab Fusion, 2023.1, the Ellipsometry Analyzer has been added to the ever-increasing array of features available in the software. It provides an easy and straightforward way to investigate the properties of coatings, multi-layer structures and gratings through the application of ellipsometry concepts on the electromagnetic field results produced by the simulation. In addition, it offers the possibility of varying the wavelength and the incidence angle automatically from within the analyzer itself, in order to conveniently generate the typical ellipsometry curves which can, after being fitted to a model, go on to reveal the material properties we seek to obtain from these experiments. You can find below links to the documentation that explains how to work with this new analyzer, as well as an example scenario in which the tool in question is applied to a silicon dioxide coating.


