Universal Detector: Field Quantities
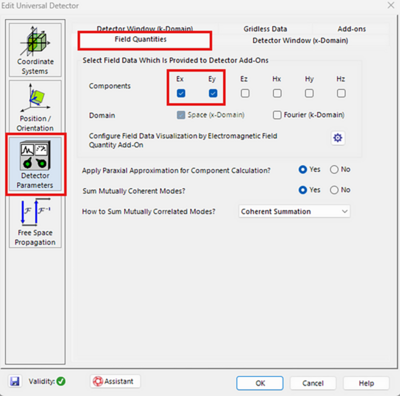
In the General Profile, the Universal Detector evaluates the Ex and Ey components of the electromagnetic field by default. To modify this:
- Double-click on the Universal Detector in your optical setup.
- Navigate to the Field Quantities tab.
In some scenarios, selecting additional components is necessary. For example:
- To plot the Ez field in a tight focus, you must include the Ez component.
- To calculate the Poynting vector, all six field components (Ex, Ey, Ez, Hx, Hy, Hz) need to be selected.
Making Plots of Field Quantities
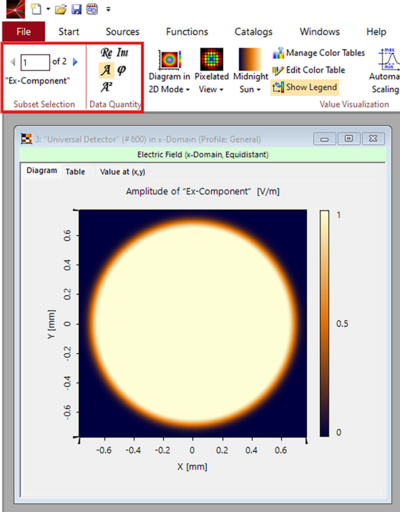
By default, the Universal Detector will display a plot of the amplitude of Ex at the end of a simulation.
You can navigate through the displayed components using the Subset Selection panel located on the left side of the ribbon. To choose which property to plot, use the Data Quantity panel. For example, selecting A will display the amplitude of the field.
Tip:
The options available in the ribbon are context-sensitive and depend on the active window. If the ribbon does not display the expected functions, ensure you have clicked on the plot to make it the active window.
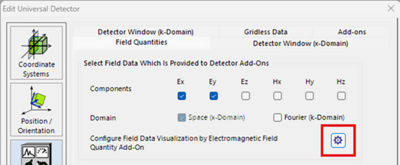
If you want to modify the parameters to plot, double-click on the Universal Detector in your optical setup, navigate to the Field Quantities tab, and click on the cogwheel icon.
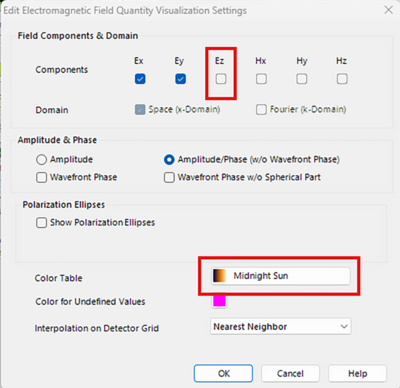
Clicking the cog wheel will open the window shown below, where you can select the field components you wish to plot. For example, you can add Ez if it is available.
Tip:
You can only visualize components that have been evaluated by the Universal Detector during the simulation. If Ez is not selectable, it indicates it was not included in the evaluation, as defined in the previous window.
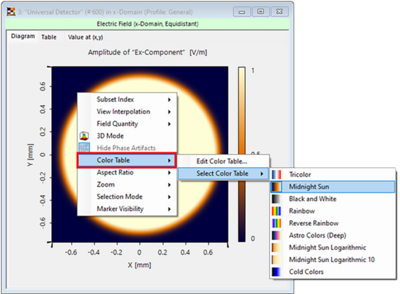
In the same window, you can select a different Color Table for plotting the data. However, you can also change the color table of an existing plot. To do this:
- Right-click on the plot.
- Select Color Table from the context menu.
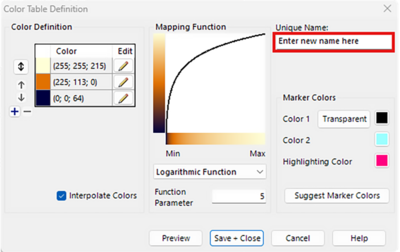
At this point, you can either choose a different color table or edit the current one.
Note:
If you edit a color table, you must assign it a new name, as the software does not allow overwriting existing color tables.
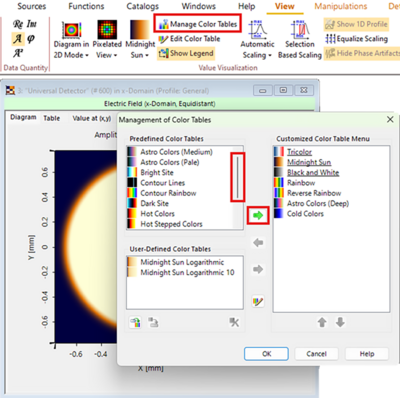
If you want to modify the list of available color tables, follow these steps:
- Click on Manage Color Tables in the ribbon.
- Use the green arrow button to add more predefined color tables to the selection menu shown on the right.
Tip:
Don’t overlook the vertical slide bar, which allows you to navigate through the available color tables.
Selected Use Cases
Find detailed technical information in the following selected samples:


